Tuesday, January 24, 2012

Tablet Ownership Almost Doubles Over Holiday Period

pew-gadget-ownership.jpg
The share of US adults who own tablets nearly doubled from 10% to 19% between mid-December 2011 and early January 2012, and the same surge in growth also applied to e-readers, which also jumped from 10% to 19% over the same period, according to [pdf] survey results released in January 2012 by the Pew Internet & American Life Project. In November 2010, just 5% of Americans owned a tablet, meaning that ownership has almost quadrupled in the past 14 months.

Friday, January 20, 2012

7 Marketing Trends to Watch in 2012

WP 2012 Trends and Tactics

What Do People See on Your Site

Go to this link and put in a website or web page.  With Google's Browersize tool you can see what percentage of the page viewers actually see.


Pages With Too Many Ads “Above The Fold” Now Penalized By Google’s “Page Layout” Algorithm

google-penalty-squareDo you shove lots of ads at the top of your web pages? Think again. Tired of doing a Google search and landing on these types of pages? Rejoice. Google has announced that it will penalize sites with pages that are top-heavy with ads.

Top Heavy With Ads? Look Out!

The change — called the “page layout algorithm” — takes direct aim at any site with pages where content is buried under tons of ads.
From Google’s post on its Inside Search blog today:
We’ve heard complaints from users that if they click on a result and it’s difficult to find the actual content, they aren’t happy with the experience. Rather than scrolling down the page past a slew of ads, users want to see content right away. So sites that don’t have much content “above-the-fold” can be affected by this change. If you click on a website and the part of the website you see first either doesn’t have a lot of visible content above-the-fold or dedicates a large fraction of the site’s initial screen real estate to ads, that’s not a very good user experience.
Such sites may not rank as highly going forward.
Google also posted the same information to its Google Webmaster Central blog.
Sites using pop-ups, pop-unders or overlay ads are not impacted by this. It only applies to static ads in fixed positions on pages themselves, Google told me.

How Much Is Too Much?

How can you tell if you’ve got too many ads above-the-fold? When I talked with the head of Google’s web spam team, Matt Cutts, he said that Google wasn’t going to provide any type of official tools similar to how it provides tools to tell if your site is too slow (site speed is another ranking signal).
Instead, Cutts told me that Google is encouraging people to make use of its Google Browser Size tool or similar tools to understand how much of a page’s content (as opposed to ads) is visible at first glance to visitors under various screen resolutions.
But how far down the page is too far? That’s left to the publisher to decide for themselves. However, the blog post stresses the change should only hit pages with an abnormally large number of ads above-the-fold, compared to the web as a whole:
We understand that placing ads above-the-fold is quite common for many websites; these ads often perform well and help publishers monetize online content. This algorithmic change does not affect sites who place ads above-the-fold to a normal degree, but affects sites that go much further to load the top of the page with ads to an excessive degree or that make it hard to find the actual original content on the page.
This new algorithmic improvement tends to impact sites where there is only a small amount of visible content above-the-fold or relevant content is persistently pushed down by large blocks of ads.

Impacts Less Than 1% Of Searches

Clearly, you’re in trouble if you have little-to-no content showing above the fold for commonly-used screen resolutions. You’ll know you’re in trouble shortly, because the change is now going into effect. If you suddenly see a drop in traffic today, and you’re heavy on the ads, chances are you’ve been hit by the new algorithm.
For those ready to panic, Cutts told me the change will impact less than 1% of Google’s searches globally, which today’s post also stresses.

Fixed Your Ads? Penalty Doesn’t Immediately Lift

What happens if you’re hit? Make changes, then wait a few weeks.
Similar to how last year’s Panda Update works, Google is examining sites it finds and effectively tagging them as being too ad-heavy or not. If you’re tagged that way, you get a ranking decrease attached to your entire site (not just particular pages) as part of today’s launch.
If you reduce ads above-the-fold, the penalty doesn’t instantly disappear. Instead, Google will make note of it when it next visits your site. But it can take several weeks until Google’s “push” or “update” until the new changes it has found are integrated into its overall ranking system, effectively removing penalties from sites that have changed and adding them to new ones that have been caught.
Google’s post explains this more:
If you decide to update your page layout, the page layout algorithm will automatically reflect the changes as we re-crawl and process enough pages from your site to assess the changes. How long that takes will depend on several factors, including the number of pages on your site and how efficiently Googlebot can crawl the content.
On a typical website, it can take several weeks for Googlebot to crawl and process enough pages to reflect layout changes on the site.
Our Why Google Panda Is More A Ranking Factor Than Algorithm Update article explains the situation with Panda, and how it took time between when publishers made changes to remove “thin” content to when they were restored to Google’s good graces. That process is just as applicable to today’s change, even though Panda itself now has much less flux.

Meanwhile, Google AdSense Pushes Ads

Ironically, on the same day that Google’s web search team announced this change, I received this message from Google’s AdSense team encouraging me to put more ads on my site:
This was in relation to my personal blog, Daggle. The image in the email suggests that Google thinks content pretty much should be surrounded by ads.
Of course, if you watch the video that Google refers me (and others) to in the email, it promotes careful placement, that user experience be considered and, at one point, shows a page top-heavy with ads as something that shouldn’t be done.
Still, it’s not hard to easily find sites using Google’s own AdSense ads that are definitely pushing content down as far down on their pages as they can or trying to hide it. Those pages, AdSense or not, are subject to the new rules, Cutts said.

Pages Ad-Heavy, But Not Top-Heavy With Ads, May Escape

As a searcher, I’m happy with the change. But it might not be perfect. For example, here’s something I tweeted about last year:

Yes, that’s my finger being used as an arrow. I was annoyed that to find the actual download link I was after was surrounded by AdSense-powered ads telling me to download other stuff.
This particular site was heavily used by kids who might easily click on an ad by mistake. That’s potentially bad ROI for those advertisers. Heck, as net-savvy adult, I found it a challenge.
But the problem here wasn’t that the content was pushed “below the fold” by ads. It was that the ratio of ads was so high in relation to the content (a single link), plus the misleading nature of the ads around the content.

Are Google’s Own Search Results Top Heavy?

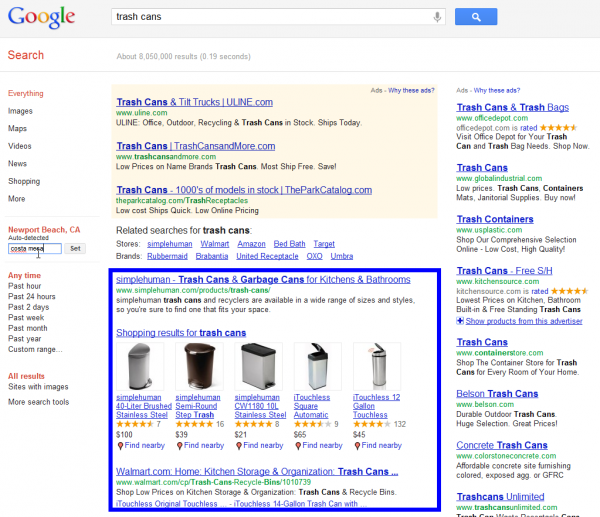
Another issue is that ads on Google’s own search results pages push the “content” — the unpaid editorial listings — down toward the bottom of the page. For example, here’s exactly what’s visible on my MacBook Pro’s 1680×1050 screen:
(Side note, that yellow color around the ads in the screenshot? It’s much darker in the screenshot than what I see with my eyes. In reality, the color is so washed-out that it might as well be invisible. That’s something some have felt has been deliberately engineered by Google to make ads less noticeable as ads).
The blue box surrounds the content, the search listings that lead you to actual merchants selling trash cans, in this example. Some may argue that the Google shopping results box is further pushing down the “real content” of listings that lead out of Google. But the shopping results themselves do lead you to external merchants, so I consider them to be content.
The example above is pretty extreme, showing the maximum of three ads that Google will ever show above its search results (with a key exception, below). Even then, there’s content visible, with it making up around half the page or more, if you include the Related Searches area as content.
My laptop’s screen resolution is pretty high, of course. Others would see less (Google’s Browser Size tool doesn’t work to measure its own search results pages). But you can expect Google will take “do as I say, not as I do” criticism on this issue.
Indeed, I shared this story initially with the main details, then started working on this section. After that was done, I could see this type of criticism already happening, both in the comments or over on my Google+ post and Facebook post about the change.
Here’s a screenshot that Daniel Weadley shared in my Google+ post about what he sees on his netbook:
In this example, Google’s doing a rare display of four ads. That’s because it’s showing the maximum of three regular ads it will show with a special Comparison Ads unit on top of those. And that will just add fuel to criticisms that if Google is taking aim at pages top-heavy with ads, it might need to also look closer to home.
NOTE: About three hours after I wrote this, Google clearly saw the criticisms about ads on its own search results pages and sent this statement:
This is a site-based algorithm that looks at all the pages across an entire site in aggregate. Although it’s possible to find a few searches on Google that trigger many ads, it’s vastly more common to have no ads or few ads on a page. Again, this algorithm change is designed to demote sites that make it difficult for a user to get to the content and offer a bad user experience.
Having an ad above-the-fold doesn’t imply that you’re affected by this change. It’s that excessive behavior that we’re working to avoid for our users.

Algorithms? Signals?

Does all this talk about ranking signals and algorithms have you confused? Our video below explains briefly how a search engine’s algorithm works to rank web pages:
Also see our Periodic Table Of SEO Ranking Factors, which explains some of the other ranking signals that Google uses in its algorithm:

Name The Update & More Info

Today’s change is a new, significant ranking factor for our table, one we’ll add in a future update, probably as Va, for “Violation, Ad-Heavy site.”
Often when Google rolls out new algorithms, it gives them names. Last year’s Panda Update was a classic example of this. But Google’s not given one to this update (I did ask). It’s just being called the “page layout algorithm.”
Boring. Unhelpful for easy reference. If you’d like to brainstorm a name, visit our posts on Google+ and on Facebook, where we’re asking for ideas.
Now for the self-interested closing. You can bet this will be a big topic of discussion at our upcoming SMX West search marketing conference at the end of next month, especially on the Ask The Search Engines panel. So check out our full agenda and consider attending.

Online Ad Spending to Surpass Print for First Time in 2012


Thursday, January 19, 2012

Internet Leads Newspapers As Source For Local Eating and Business Information


According to The Pew Research Center's Project for Excellence in Journalism and Internet & American Life Project in partnership with the Knight Foundation, people looking for information about local restaurants and other businesses say they rely on the internet, especially search engines, ahead of any other source. Newspapers, both printed copies and the websites of newspaper companies, run second behind the internet as the source that people rely on for news and information about local businesses, including restaurants and bars. Word of mouth, particularly among non-internet users, is also an important source of information about local businesses.
People who seek out information and news about local businesses and restaurants are a diverse and somewhat upscale group. As distinct populations, they are more likely to live in households earning $75,000 or more, and have college educations. In addition, the 55% of adults who get information about restaurants, bars, and clubs are more likely to be women, young adults, urban, and technology adopters.  The 60% of adults who get information about other local businesses are also more likely to be tech users.
Local restaurants, bars, and clubs overview...  55% of adults say they get news and information about local restaurants, bars, and clubs, with predominant sources such as: 51% turn to the internet, and:
• 38% rely on search engines
• 17% rely on specialty websites
• 3% rely on social networking sites or Twitter
• 31% rely on newspapers, including
• 26% rely on printed copies
• 5% rely on newspaper websites
• 23% rely on word of mouth, while 8% rely on local TV, either broadcasts or websites
Local Businesses overview...
60% of adults say they get news and information about local businesses other than restaurants and bars. When they do:
47% say they rely most on the internet, including:
• 36% rely on search engines - them
• 16% rely on specialty websites - them
• 1% rely on social network sites or Twitter
• 30% rely most on newspapers, including 29% who rely most on printed newspapers and 2% who rely on
newspaper websites In addition, 22% rely on word of mouth from family and friends, 8% rely on local TV, either broadcasts or the websites of local stations, and 5% rely on local radio Specifically, those seeking local information about restaurants, bars, and clubs... The 55% of all adults who get information about restaurants, bars, and clubs are disproportionately young, female, tech adaptive and upscale in educational attainment, urban. They are also likely to be avid local news consumers who enjoy following the local scene, pay for local news in some form, and use multiple platforms to get the local information. Those who are heavy local news junkies are considerably more likely than others to get material about local restaurants. 71% of those who used at least six platforms monthly got news and information about local restaurants, compared with 34% of those who relied on just one or two sources. 47% of all adults said they got local news and information their cell phones, and these mobile consumers were younger and more upscale in terms of their household income and educational levels, were even more likely than others to get material about local restaurants: 62% of mobile local news consumers got information about local businesses, compared with 48% of others.
The 55% of adults who said they got information about local restaurants relied on these sources:
• 51% of those who get information about local entertainment businesses rely most on some kind of online
source for that material.
• 31% of them say they rely on newspaper material either in printed form or the website of their local
newspaper for information about restaurants, bars, and clubs
• 23% of them say they rely on other people most of all for news and information about for information about restaurants, bars, and clubs
• 8% of them say they rely on TV for news about for information about restaurants, bars, and clubs – either
broadcasts or the stations’ websites Local businesses other than restaurants, bars, and clubs...
Those who get information about local businesses that are not tied to eating or socializing are a diverse and
somewhat upscale group. Those who get this information are more likely to have college or advanced degrees, live in relatively high-earning households, use the internet and own cell phones. They are not distinct by gender or race and ethnicity. They are also likely to be local news and information junkies. Those who get news and information from at least six different local news platforms monthly are considerably more likely than others to get material about local businesses.
72% of those who used at least six platforms monthly got news and information about local businesses, compared with 39% of those who relied on just one or two sources. Additionally, 47% of all adults said they got local news and information their cell phones and those mobile consumers were also more likely than others to get material about local businesses: 65% of mobile local news consumers got information about local businesses, compared with 55% of others. The 60% of adults who said they got information about local businesses relied on these sources for such information, in broad terms:
• Internet: 47% say some kind of online source is the one they most rely upon.
• Newspaper: 30% say they most rely on newspaper material either in printed form or the website of their
local newspaper for local business information
• Word of mouth: 22% say they rely on other people most of all for news and information about local
businesses
• Local TV: 8% say they rely on TV for news about local businesses – either broadcasts or the stations’
websites
• Local radio: 5% of adults say they rely on local radio
11% of the respondents who get information about local businesses cited other sources beyond the main
categories that we used. These answers might have included such things as advertising messaging via such things as billboards, signs, or phone directories; salesclerk or stranger recommendations; observations of foot traffic to stores; and general awareness of brands or merchants that didn’t arise from any particular information source. The results, based on data from telephone interviews conducted by Princeton Survey Research Associates International, conducted in English and Spanish by landline and cell phone, yield 95% confidence that the error attributable to sampling is plus or minus 2.4 percentage points. – Research Brief

Wednesday, January 18, 2012

What is Your Overall Facebook Fan Worth?

posted on November 23rd, 2011
  to a Facebook friend
Facebook Fan WorthSocial media agency SocialCode has announced a new study claiming that Facebook fan worth amounts to about $10 per fan, assuming that a brand is advertising with a continuous $1 cost-per-click.
The study – it looked at over five million Facebook ads created by over 50 clients in various industries this year. Results showed that fans were much more likely than non-fans to convert when prompted by ads.
The results – In fact, 19% of the ad-clickers who installed an app, entered a contest, voted in a contest, liked a sub-brand, signed up for a program, made a purchase, or entered a sweepstakes were already Facebook fans of the brand. Only 7% of people who completed one or more of these actions were non-fans.

Facebook Fan Worth vs. Twitter Follower Worth

Facebook Fan Worth vs Twitter Fan Worth
Although the absolute value of a Twitter follower is difficult to measure, a study by Forrester Research has confirmed that Twitter followers are more likely than Facebook fans to buy from brands that they follow. (Twitter followers buying = 37%; Facebook fans buying = 21%). Twitter followers are also more likely to recommend brands to friends (33% vs. 21%).

What Does Facebook Fan Worth Mean For My Brand?

Facebook and Twitter each have their strengths and weaknesses as marketing tools. It is important to use both platforms to promote your brand, and to also understand how to make them work best for your brand. For example, Facebook is a great host for powerful images and video content.
Twitter is valuable tool for answering customer service questions and keeping in close touch with followers. Ultimately, Facebook fan worth and Twitter follower worth are dependent on how truly engaging and relevant your product or service is.

Friday, January 13, 2012

Making Money with Facebook Contests | Second Street Online Promotions Platform

Making Money with Facebook Contests Second Street Online Promotions Platform

Support Your Local Newspaper Reporter

According to the 2011 results of an annual survey conducted by he National Newspaper Association and the
research arm of the Reynolds Journalism Institute at the Missouri School of Journalism, readers in areas served by community newspapers continue to prefer the community newspaper as their source of local news and advertising. The study shows that 74% of people in communities served by a newspaper with circulations under 15,000 read a local newspaper each week. They prefer the printed copy to the online version, with 48% saying they never read the local news online. They prefer to receive advertising through the newspaper (51%) instead of on the Internet (11%). And only about a quarter of respondents said they had found local news through a mobile device in the past 30 days. 38% said they had received local shopping information by mobile device.
81% of local residents rely on the paper for local news and information, according to a survey. 86% of respondents say their local newspaper is informative, and 3 in 4 look forward to reading it. They also have a strong preference for government accountability through newspaper public notice, with 80% saying the government should be required to publish notices in the newspaper.
Community Newspaper Values (% of Local Residents Agreeing)
Value % Agreeing
Informative 85.9
Rely on for local news/info 81.4
Look forward to reading 75.1
Valuable shopping/ad info 69.2
Entertaining 64.9
Source: NAA 2011 Community Newspaper Readership Survey, December 2011
NNA President Reed Anfinson, publisher of the Swift County Monitor-News in Benson, MN, says “... the survey indicates a majority of respondents believe that the newspaper... provides more background and depth... is more useful to them than other news sources... ”
Since 2005, NNA has done research on how people read and what they think about their local newspaper. Results have been consistent over the years, even as sample and community sizes have been adjusted slightly. The data indicates that the positive findings in the earlier surveys are consistent for community newspapers:
• 74% of those surveyed read a local newspaper each week
• Those readers, on average, share their paper with 2.33 persons
• They spend about 38.95 minutes reading their local newspaper
• 73% read most or all of their community newspaper
• 43.8% keep their community newspaper six or more days (shelf life)
• 61% of readers read local news very often in their community newspaper
• 48% say they never read local news online (only 11% say they read local news very often online)
• Of those going online for local news (167 respondents), 52% found it on the local newspaper’s website,
compared to 20% for sites such as Yahoo, MSN or Google, and 25% for the website of a local TV station
• 33% of those surveyed read local education (school) news very often in their newspaper, while 68% never
read local education news online
• 27% read local sports news very often in their newspaper, while 70% never read local sports online
• 40% read editorials or letters to the editor very often in their newspaper, while 64% never read editorials or
letters to the editor online
• 80% think governments should be required to publish public notices in newspapers, with 23% reading
public notices very often in their newspaper
• 70% have Internet access in the home, but 80% never visit the Web site of their local chamber of
commerce
The local community newspaper is the primary source of information about the local community for 51.8% of
respondents compared to seeking information from friends and relatives (16%) and TV (13.2%.) (7.4%), says the report. Less than 6% say their primary local news source is radio.
Of those with Internet access at home, 89% have broadband access. Readers are seven times more likely to get their news from their community newspaper than from the Internet Data from the survey indicates that given the choice, 8 in 10 respondents say they would rather look through ads in the newspapers than view ads on the internet. Two-thirds of respondents agree that they often use newspaper
advertising inserts to help make purchasing decisions. Similarly, two-thirds agree that they often seek out
newspaper advertising to find information on the latest offerings and sales available in their area, and almost half say that there are days when they read the newspaper as much for the ads as for the content.
Prefer Newspaper Ads to TV Ads (% of Respondents)
Attitude % of Respondents
Strongly agree 56%
Somewhat agree 23
Somewhat disagree 10
Strongly disagree 11
Source: NNA 2011 Community Newspaper Readership Survey, December 2011
-Research Brief

SoLoMo Revolution Picks Up Where Hyperlocal Search Left Off


SoLoMo Revolution Picks Up Where Hyperlocal Search Left Off


The Future of Search Series is supported by SES New York, the leading search, social and display conference. From March 19 to 23, get five days of education, inspiration and conversations with marketing experts from the digital space. Register with MASH20 to save 20%.
Hyperlocal search was a hot-button term a few years ago, but there’s a new phrase in town that takes its predecessor to a whole new social level: SoLoMo.
The phrase “hyperlocal search” emerged when PC users searching for local information on engine sites such as Google were connected to the latest information, news and deals for that area. But now with rise of smartphones and tablets that integrate geo-location technology such as GPS to help users locate what’s around them, the term has evolved into what industry experts are calling Social Local Mobile Search (SoLoMo).
“‘Hyperlocal search’ may be dying, but the phenomenon is evolving and becoming more mobile,” says Greg Sterling, senior analyst with San Francisco-based consultancy Opus Research. “SoLoMo is a more mobile-centric version of the same concept with greater local precision: It’s about getting nearby information on demand, wherever you may be.”
In recent years, the big search engines have focused on improving localization of both content and advertising on the PC. If a retailer advertised on the homepage of Yahoo, content on that ad might be targeted according to a user’s IP address. For example, an ad for Macy’s might vary the messaging or show the store nearest to the IP address being accessed.
However, the accuracy of this information wasn’t always reliable. In fact, an IP address can be associated with a place miles away from where the computer is actually located. The geo-location technology on mobile devices is far superior, says Sterling, and since more people are adopting smartphones and tablets, marketers and major companies have infused this into their business strategies.
“The Yellow Pages and newspapers have always dominated the local space, but ‘local’ has now expanded far beyond traditional media, and many more players are tapping into what was once considered a niche market,” Sterling says.
Service companies from Groupon, Yelp and Foursquare to retailers such as Starbucks have embraced SoLoMo and geo-location tactics, primarily in the form of apps. For example, a shopper craving a cup of Starbucks coffee can search for the store closest to his location.


Facebook has also recently flirted with SoLoMo, allowing members to check-in via Places and purchase local services through its now-defunct Deals initiative. However, it still has room for growth.
“Facebook hasn’t really gotten it right with any its local efforts yet,” Sterling says. “The company is very interested in local, but it hasn’t fully committed to any particular initiative.”
Meanwhile, mobile app Shopkick is excelling at SoLoMo by sending rewards and offers to shoppers simply for walking into stores. The shopkick app detects a signal emitted from a device located in each participating store and it’s picked up by the microphone of a shopper’s phone. The detection occurs on the user’s mobile device, so the privacy of information is under the user’s control. The app then pushes out coupons and information about deals occurring within the store.
Related to the evolution of hyperlocal search and SoLoMo marketing is geofencing technology, which is a virtual perimeter for a geographic area. The concept is being embraced by some retailers and shopping centers nationwide. For example, real estate company DDR Corp., which owns hundreds of U.S. shopping centers, is using a location-based mobile marketing service at its 27 open-air malls across 16 markets to text deals from the retail tenants within those malls.
DDR’s program ValuText, which is powered by Placecast, picks up when shoppers enter a mall’s border and those who have opted-in to the service receive text messages about sales and promotions happening in real time.
“Concepts like this bridge the gap between the in-store and online world, and allow retailers to better learn where their shoppers are coming from,” Sterling says.
Karen Hitchcock, vice president of marketing for social local mobile marketing firm SoLoMo Technology, says the concept isn’t just a passing fad: “SoLoMo is now an integral part of business strategy for companies that seek to grow, scale and connect with customers in new ways.”
Hitchcock adds that consumers always want highly-personalized experiences — with companies, doctors, merchants and friends, too – so this type of marketing is a natural progression of demand and technology.
“We all have an intrinsic desire to feel special and to be part of a community,” Hitchcock says. “We now have the technology to support the psychological, social and business needs that people have, and this not only helps merchants get their message out, but it also allows the consumer to have an extremely personalized shopping experience.”

Thursday, January 12, 2012

Combine Print with Social Media Plus e-Commerce

Conde Nast Print Ads to Feature Mobile E-commerce
Glamour plans to run print ads in March allowing readers to purchase items with a scan of their smart phone, the glossy title tells ClickZ News. The Condé Nast property isn't revealing advertisers for the issue yet, but suggests there's no shortage of interest from brands and retailers.
The upcoming initiative builds on a so-called "social issue" published in September. Teaming with Glamour editorial, the marketing department put together content that pushed the download of a "Friends & Fans" mobile app. The content provided step-by-step details for readers on how to like advertisers on Facebook via the QR code-enabled   print ads. The copy highlighted how "liking" brands would lead to exclusive discounts for their products. The program went well. According to Condé Nast, it produced 512,339 print engagements among a circulation of 2  million readers. Advertisers collected 50,814 Facebook likes through the effort, which included fashion/beauty, retail, CPG, and tech brands. Among them were Gap, Lancome, Skinny Cow, GNC, Land's End, and HTC.
Those brands got a 4 percent response rate to the QR-enabled ads, the magazine said. The September issue used SpyderLynk's SnapTag QR mobile marketing technology. "Our advertisers were pretty psyched with the results," said Jenny Bowman, creative services director at Glamour. "We were getting so many questions about how [brands] could increase their likes on Facebook, and we wanted to do something digital and cool. There were elements on Twitter and ways to win prizes as well. In the end, we were able to attract 25 advertisers into that issue that wanted to build likes on Facebook." So Glamour plans to push digital a little further into the page, combining print with social media and mobile
commerce. Bowman has dubbed March the "instant gratification issue," while she said that it has drawn interestfrom around 30 advertisers. - ClickZ