
Wednesday, June 20, 2012


Tuesday, June 19, 2012

Saturday, June 16, 2012
Thursday, June 14, 2012

comScore 2012 U.S. Online Video Information
Other notable findings from April 2012 include:
RESTON, VA, May 18, 2012 – comScore, Inc. (NASDAQ: SCOR), a leader in measuring the digital world, today released data from the comScore Video Metrix service showing that 181 million U.S. Internet users watched nearly 37 billion online content videos in April. Video ads saw another record-breaking month with nearly 9.5 billion, representing 1 in 5 videos viewed online in April.
Top 10 Video Content Properties by Unique Viewers
Google Sites, driven primarily by video viewing at YouTube.com, ranked as the top online video content property in April with 157.7 million unique viewers, followed by Yahoo! Sites with 53.6 million, VEVO with 49.5 million, Facebook.com with 44.3 million and Microsoft Sites with 42.8 million. Nearly 37 billion video views occurred during the month, with Google Sites generating the highest number at 17 billion, followed by Hulu with 901 million and Yahoo! Sites with 742 million. The average viewer watched 21.8 hours of online video content, with Google Sites (7.2 hours) and Hulu (3.8 hours) earning the highest average engagement among the top ten properties.
*A video is defined as any streamed segment of audiovisual content,
including both progressive downloads and live streams. For long-form, segmented
content, (e.g. television episodes with ad pods in the middle) each segment of
the content is counted as a distinct video stream.
Top 10 Video Ad Properties by Video Ads Viewed
Americans viewed 9.5 billion video ads in April, representing another month of record video ad views. Hulu topped the chart with 1.6 billion video ads delivered, followed by Google Sites with 1.3 billion, BrightRoll Video Network with 943 million, Adap.tv with 881 million and TubeMogul Video Ad Platform with 831 million. Time spent watching video ads totaled 3.9 billion minutes, with Hulu delivering the highest duration of video ads at 670 million minutes. Video ads reached 52 percent of the total U.S. population an average of 60 times during the month. Hulu delivered the highest frequency of video ads to its viewers with an average of 49, while ESPN delivered an average of 27 ads per viewer.
*Video ads include streaming-video advertising only and do not include
other types of video monetization, such as overlays, branded players, matching
banner ads, etc.
**Indicates video ad network
†Indicates video ad exchange
Top 10 YouTube Partner Channels by Unique Viewers
The April 2012 YouTube partner data revealed that video music channels VEVO (48.3 million viewers) and Warner Music (28.6 million viewers) maintained the top two positions. Gaming channel Machinima ranked third with 23.1 million viewers, followed by Maker Studios Inc. with 15.4 million, FullScreen with 12.3 million and BroadbandTV with 8.2 million. Among the top 10 YouTube partners, Machinima demonstrated the highest engagement (65 minutes per viewer) followed by VEVO (57 minutes per viewer). VEVO streamed the most videos (644 million), followed by Machinima (382 million).
*YouTube Partner Reporting based on online video content viewing and does
not include claimed user-generated content
- 84.5 percent of the U.S. Internet audience viewed online video.
- The duration of the average online content video was 6.4 minutes, while the average online video ad was 0.4 minutes.
- Video ads accounted for 20.5 percent of all videos viewed and 1.6 percent of all minutes spent viewing video online.
comScore Releases April 2012 U.S. Online Video Rankings
Video Ad Delivery Continues to Soar to New Heights, Representing 1 in 5 Videos ViewedRESTON, VA, May 18, 2012 – comScore, Inc. (NASDAQ: SCOR), a leader in measuring the digital world, today released data from the comScore Video Metrix service showing that 181 million U.S. Internet users watched nearly 37 billion online content videos in April. Video ads saw another record-breaking month with nearly 9.5 billion, representing 1 in 5 videos viewed online in April.
Top 10 Video Content Properties by Unique Viewers
Google Sites, driven primarily by video viewing at YouTube.com, ranked as the top online video content property in April with 157.7 million unique viewers, followed by Yahoo! Sites with 53.6 million, VEVO with 49.5 million, Facebook.com with 44.3 million and Microsoft Sites with 42.8 million. Nearly 37 billion video views occurred during the month, with Google Sites generating the highest number at 17 billion, followed by Hulu with 901 million and Yahoo! Sites with 742 million. The average viewer watched 21.8 hours of online video content, with Google Sites (7.2 hours) and Hulu (3.8 hours) earning the highest average engagement among the top ten properties.
| Top U.S. Online Video Content Properties
Ranked by Unique Video Viewers April 2012 Total U.S. – Home and Work Locations Content Videos Only (Ad Videos Not Included) Source: comScore Video Metrix | |||
| Property | Total Unique Viewers (000) | Videos (000)* | Minutes per Viewer |
| Total Internet : Total Audience | 180,785 | 36,848,001 | 1,307.7 |
| Google Sites | 157,663 | 17,022,226 | 434.8 |
| Yahoo! Sites | 53,604 | 741,995 | 73.7 |
| VEVO | 49,479 | 674,183 | 57.9 |
| Facebook.com | 44,298 | 264,903 | 27.0 |
| Microsoft Sites | 42,833 | 486,567 | 42.4 |
| Viacom Digital | 41,247 | 501,100 | 58.9 |
| AOL, Inc. | 38,925 | 496,400 | 54.3 |
| Amazon Sites | 30,168 | 104,581 | 17.4 |
| Hulu | 28,233 | 901,060 | 228.5 |
| News Distribution Network, Inc. | 27,005 | 186,956 | 75.2 |
Top 10 Video Ad Properties by Video Ads Viewed
Americans viewed 9.5 billion video ads in April, representing another month of record video ad views. Hulu topped the chart with 1.6 billion video ads delivered, followed by Google Sites with 1.3 billion, BrightRoll Video Network with 943 million, Adap.tv with 881 million and TubeMogul Video Ad Platform with 831 million. Time spent watching video ads totaled 3.9 billion minutes, with Hulu delivering the highest duration of video ads at 670 million minutes. Video ads reached 52 percent of the total U.S. population an average of 60 times during the month. Hulu delivered the highest frequency of video ads to its viewers with an average of 49, while ESPN delivered an average of 27 ads per viewer.
| Top U.S. Online Video Ad Properties Ranked
by Video Ads* Viewed April 2012 Total U.S. – Home and Work Locations Ad Videos Only (Content Videos Not Included) Source: comScore Video Metrix | ||||
| Property | Video Ads (000) | Total Ad Minutes (MM) | Frequency (Ads per Viewer) | % Reach Total U.S. Population |
| Total Internet : Total Audience | 9,478,975 | 3,937 | 59.8 | 51.7 |
| Hulu | 1,597,166 | 670 | 48.6 | 10.7 |
| Google Sites | 1,319,342 | 136 | 17.7 | 24.3 |
| BrightRoll Video Network** | 942,899 | 566 | 9.1 | 33.8 |
| Adap.tv† | 880,522 | 525 | 12.7 | 22.5 |
| TubeMogul Video Ad Platform** | 830,621 | 230 | 17.1 | 15.9 |
| SpotXchange Video Ad Marketplace** | 666,588 | 367 | 12.8 | 17.0 |
| Tremor Video** | 661,727 | 360 | 13.2 | 16.3 |
| Specific Media** | 650,578 | 314 | 6.9 | 30.9 |
| ESPN | 514,347 | 189 | 26.6 | 6.3 |
| Auditude, Inc.** | 511,278 | 202 | 11.3 | 14.8 |
**Indicates video ad network
†Indicates video ad exchange
Top 10 YouTube Partner Channels by Unique Viewers
The April 2012 YouTube partner data revealed that video music channels VEVO (48.3 million viewers) and Warner Music (28.6 million viewers) maintained the top two positions. Gaming channel Machinima ranked third with 23.1 million viewers, followed by Maker Studios Inc. with 15.4 million, FullScreen with 12.3 million and BroadbandTV with 8.2 million. Among the top 10 YouTube partners, Machinima demonstrated the highest engagement (65 minutes per viewer) followed by VEVO (57 minutes per viewer). VEVO streamed the most videos (644 million), followed by Machinima (382 million).
| Top YouTube Partner Channels* Ranked by
Unique Video Viewers April 2012 Total U.S. – Home and Work Locations Content Videos Only (Ad Videos Not Included) Source: comScore Video Metrix | |||
| Property | Total Unique Viewers (000) | Videos (000) | Minutes per Viewer |
| VEVO @ YouTube | 48,307 | 644,111 | 56.7 |
| Warner Music @ Youtube | 28,632 | 177,251 | 25.0 |
| Machinima @ YouTube | 23,146 | 382,360 | 65.0 |
| Maker Studios Inc. @ YouTube | 15,353 | 165,485 | 43.9 |
| FullScreen @ YouTube | 12,331 | 58,994 | 18.1 |
| BroadbandTV @ YouTube | 8,218 | 38,245 | 17.2 |
| Big Frame @ YouTube | 7,266 | 41,647 | 20.3 |
| Demand Media @ YouTube | 6,321 | 15,622 | 8.1 |
| Clevvertv @ YouTube | 6,076 | 12,541 | 7.6 |
| IGN @ YouTube | 5,933 | 30,663 | 16.8 |
Tuesday, June 12, 2012
Papa Bucks Redemption & Happy Hour
 |
| Some of us heard "Take Your Dog to Work Day" could be a possibility ;-) |


Congratulations to everyone who earned Papa Bucks - enjoy your prizes!!
Google Places Changes to Google+
-
Local—now with a dash of Zagat and a sprinkle of Google+
May 30, 2012 at 6:22 AMFinding the best places to go is an essential part of our lives, as are the people and resources that help us make those decisions. In fact, the opinions of friends, family or other trusted sources are often the first we seek when looking for the perfect restaurant for date night or the cafe that makes the best latte ever.
Today, we’re rolling out Google+ Local, a simple way to discover and share local information featuring Zagat scores and recommendations from people you trust in Google+. Google+ Local helps people like my husband turn a craving—“Wow, I need brunch”—into an afternoon outing: “Perfect, there’s a dim sum place with great reviews just two blocks from here. Let’s go.” It’s integrated into Search, Maps and mobile and available as a new tab in Google+—creating one simple experience across Google.

Local information integrated across Google
From the new “Local” tab on the left-hand side of Google+, you can search for specific places or browse for ones that fit your mood. If you click on a restaurant, or a museum (or whatever), you’ll be taken to a local Google+ page that includes photos, Zagat scores and summaries, reviews from people you know, and other useful information like address and opening hours.
Google+ Local is also integrated across other products you already use every day. If you’re looking for a place on Search or Maps, you get the same great local information there too. You can also take it on the go with Google Maps for mobile on your Android device, and soon on iOS devices.
 A search on Google Maps
 Google+ Local on an Android phone
Better decisions with Zagat
Since Zagat joined the Google family last fall, our teams have been working together to improve the way you find great local information. Zagat has offered high-quality reviews, based on user-written submissions and surveys, of tens of thousands of places for more than three decades. All of Zagat’s accurate scores and summaries are now highlighted on local Google+ pages.

Each place you see in Google+ Local will now be scored using Zagat’s 30-point scale, which tells you all about the various aspects of a place so you can make the best decisions. For example, a restaurant that has great food but not great decor might be 4 stars, but with Zagat you’d see a 26 in Food and an 8 in Decor, and know that it might not be the best place for date night.
Recommendations and reviews from people you know and trust
Your friends know what you like, and they probably like the same things you do. That’s why the opinions of people in your circles are front and center. If you search for [tacos] on Google+ Local, your results might include a friend’s rave review of the Baja-style taco stand in your neighborhood. And if you’re searching on Google or Google Maps for a great place to buy a gift for that same friend, your results might include a review from her about a boutique she shops at all the time.
You can also share your opinions and upload photos. These reviews and photos will help your friends when they’re checking out a place, and are also integrated into the aggregate score that other people see. The more you contribute, the more helpful Google+ Local will be for your friends, family and everyone else.

Whether it’s a block you’ve lived on for years or a city you’ve never been to before, we hope Google+ Local helps you discover new gems.
Today is just the first step, and you’ll see more updates in the coming months. If you’re a business owner, you can continue to manage your local listing information via Google Places for Business. Soon we’ll make it even easier for business owners to manage their listings on Google and to take full advantage of the social features provided by local Google+ pages. Get more information on our Google and Your Business Blog.
(Cross-posted on the Zagat and Lat Long Blogs)


Friday, June 8, 2012
Coupon Contests Have Highest Entries on Facebook
Campaigns On Facebook Vary To Assure Earned Media
According to a recent Wildfire analysis of over 10,000 social media campaigns to see what types of campaignsearned media, or sharing activity. Certain campaign application types generate higher entry and participation rates(contests and sweepstakes for example), while other types are more likely to be shared via a news feed post or an invite to the app (pick-your-favorites, quizzes and trivia).
When 68% of Facebook users say that a recommendation from a Facebook friend would make them more likely tobuy a specific product or visit a retailer, however, brands want all the earned media they can get, says the report.Promotions are one of the most popular marketing methods on Facebook whether sweepstakes, contests, or coupons and more. The study reports a number of actionable results for social marketers, including the types of social marketing campaign that tend to get the highest participation rates, the different campaign types that get thehighest sharing rates, and the common thread among campaign types that generates the most sharing with friends on Facebook.
In addition, other key findings from the study include:
• Coupons, giveaways, and sweepstakes get the highest amount of entries on average.
• “Pick-your-favorites,” quizzes and trivia that get the most shares by users, thus creating more earned
media for the brand.
• The campaign types that generate the most earned media are those that allow users to reveal personal
preferences, tastes or opinions to their Facebook friends. These include pick-your-favorites, quiz and trivia
applications.
• People are equally as likely to enter contests and sweepstakes whether they heard about them directly
from a brand or from a friend’s post. In other words, where a user learns about a contest or sweepstakes
within Facebook does not impact the likelihood they will enter it.
• The earned media generated by users sharing to their networks about interactions with these apps resulted
in a significant conversion of new users— in other words, the earned media is working. For example, 82%
of the users that clicked on a friend’s news feed post about a quiz they’d taken went on to take the quiz
themselves.
On average, coupons, giveaways, and sweepstakes get the most entries and Facebook engagement. These
campaigns are closely correlated with low barriers to entry (as in a sweepstakes), high-value perceived rewards (aswith coupons), and the popularity of a “sure thing” (as with giveaways).
Most Entries And Facebook Engagement (What types of campaigns get the most entries?)
Campaign Average Entries
Coupon 3,037
Giveaway 1,888
Sweepstakes 1,630
Favorites 1,070
Quiz 1,024
Trivia 410
Essay contest 398
Photo contest 381
Video contest 318
Source: Wildfire, May 2012
When earned media is the focus of the analysis, an entirely new set of high performing campaign types emerge, with an interesting commonality. The campaigns types that are most “shareable” are campaigns that include “pick-your favorites,”quizzes, and trivia.
The most-shared campaign applications are designed to either:
• Allow the user to discover an aspect of his personality of which he was previously unaware
• Display facets of his personality that he knows about and wants to share
The most important question of all, says the report, is whether or not the shares generated by users get addition new users to engage with the branded campaign too. The analysis of earned media’s ability to draw additional users into engagement with a brand showed positive results: “pick-your-favorites,” survey, and quiz campaigns (that appear in users’ news feeds) have a high chance of being seen and clicked on by their friends.The study reveals that 82% of the users that click on a news feed post, shared by a friend who took a quiz, will go on to take that quiz themselves. This indicates that when a user’s attention is piqued by the news feed, the engagement potential is very high.
Earned Media Click-To-Entry Conversion Rate (When a user clicks on earned media, how often do they go on to enter the campaign themselves?) The report says that earned media can account for up to a 12% boost in engagement rates, which means viewing, clicking and participating with a campaign. – Research Brief
According to a recent Wildfire analysis of over 10,000 social media campaigns to see what types of campaignsearned media, or sharing activity. Certain campaign application types generate higher entry and participation rates(contests and sweepstakes for example), while other types are more likely to be shared via a news feed post or an invite to the app (pick-your-favorites, quizzes and trivia).
When 68% of Facebook users say that a recommendation from a Facebook friend would make them more likely tobuy a specific product or visit a retailer, however, brands want all the earned media they can get, says the report.Promotions are one of the most popular marketing methods on Facebook whether sweepstakes, contests, or coupons and more. The study reports a number of actionable results for social marketers, including the types of social marketing campaign that tend to get the highest participation rates, the different campaign types that get thehighest sharing rates, and the common thread among campaign types that generates the most sharing with friends on Facebook.
In addition, other key findings from the study include:
• Coupons, giveaways, and sweepstakes get the highest amount of entries on average.
• “Pick-your-favorites,” quizzes and trivia that get the most shares by users, thus creating more earned
media for the brand.
• The campaign types that generate the most earned media are those that allow users to reveal personal
preferences, tastes or opinions to their Facebook friends. These include pick-your-favorites, quiz and trivia
applications.
• People are equally as likely to enter contests and sweepstakes whether they heard about them directly
from a brand or from a friend’s post. In other words, where a user learns about a contest or sweepstakes
within Facebook does not impact the likelihood they will enter it.
• The earned media generated by users sharing to their networks about interactions with these apps resulted
in a significant conversion of new users— in other words, the earned media is working. For example, 82%
of the users that clicked on a friend’s news feed post about a quiz they’d taken went on to take the quiz
themselves.
On average, coupons, giveaways, and sweepstakes get the most entries and Facebook engagement. These
campaigns are closely correlated with low barriers to entry (as in a sweepstakes), high-value perceived rewards (aswith coupons), and the popularity of a “sure thing” (as with giveaways).
Most Entries And Facebook Engagement (What types of campaigns get the most entries?)
Campaign Average Entries
Coupon 3,037
Giveaway 1,888
Sweepstakes 1,630
Favorites 1,070
Quiz 1,024
Trivia 410
Essay contest 398
Photo contest 381
Video contest 318
Source: Wildfire, May 2012
When earned media is the focus of the analysis, an entirely new set of high performing campaign types emerge, with an interesting commonality. The campaigns types that are most “shareable” are campaigns that include “pick-your favorites,”quizzes, and trivia.
The most-shared campaign applications are designed to either:
• Allow the user to discover an aspect of his personality of which he was previously unaware
• Display facets of his personality that he knows about and wants to share
The most important question of all, says the report, is whether or not the shares generated by users get addition new users to engage with the branded campaign too. The analysis of earned media’s ability to draw additional users into engagement with a brand showed positive results: “pick-your-favorites,” survey, and quiz campaigns (that appear in users’ news feeds) have a high chance of being seen and clicked on by their friends.The study reveals that 82% of the users that click on a news feed post, shared by a friend who took a quiz, will go on to take that quiz themselves. This indicates that when a user’s attention is piqued by the news feed, the engagement potential is very high.
Earned Media Click-To-Entry Conversion Rate (When a user clicks on earned media, how often do they go on to enter the campaign themselves?) The report says that earned media can account for up to a 12% boost in engagement rates, which means viewing, clicking and participating with a campaign. – Research Brief
Wednesday, June 6, 2012
News Consumption #4 for Use on Mobile Devices
Survey: Mobile users as likely to be print news subscribers as non-mobile users

Consumers aren’t rushing to replace their magazine and newspaper subscriptions with mobile news products, according to a new survey by the Donald W. Reynolds Journalism Institute at the University of Missouri.
The survey shows that although nearly two-thirds of U.S. adults use at least one mobile device per day, nearly equal percentages of mobile media device users and non-users – 39.8 percent and 40.2 percent respectively — said they still subscribed to at least one newspaper or news magazine, which suggests users of smartphones and tablets aren’t abandoning print media.
- This RJI survey was conducted during the 1st quarter of 2012.

The RJI survey also finds that nearly half of those who own Apple iPads and 25 percent of Android-powered tablet owners, said that they still subscribe to printed newspapers and news magazines. Apple iPhone and Blackberry owners were significantly more likely to be newspaper or news magazine subscribers than were owners of Android-powered smartphones.
- The survey also showed gender and age gaps in smartphone and tablet adoption.

The survey shows “news consumption ranks fourth among reasons people use
mobile devices, behind interpersonal communications, entertainment, and internet
usage for information not provided by news organizations,” reports Futurity.org, which features research from
top universities in the U.S., Great Britain and Canada.
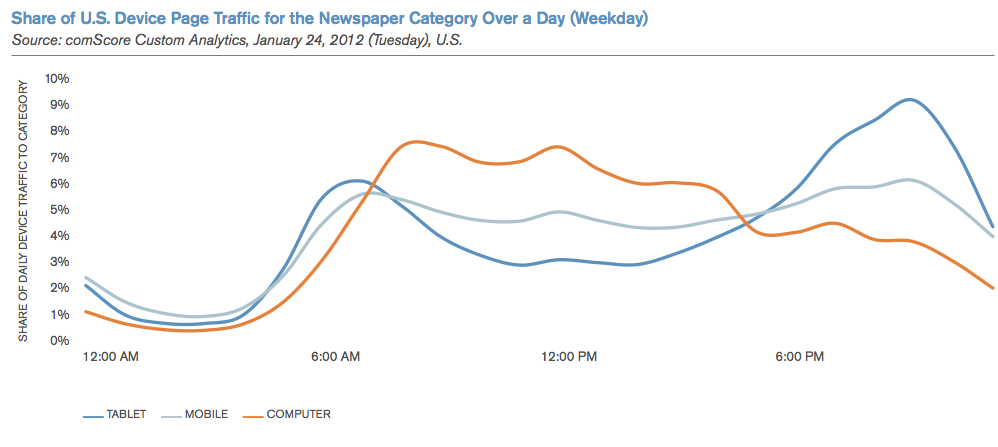
This research is consistent with comScore data from earlier this year that
found consumers are rapidly adopting both smartphones and
tablets, while still using PCs for news. The general trend seems to be that
night owls read news on tablets, while mobile overtakes
computers for at-home browsing.- This same comScore analysis found that the share of daily traffic to computers dropped on weekends.

This may explain why magazine publishers are failing to fully embrace the mobile revolution. “Two years after the iPad’s launch, many consumer magazines remain absent from the platform that’s redefining media consumption,” Peter Kirwan reports. “For some publishers, it’s as if 45 million iPad shipments never really happened.”
Subscribe to:
Posts (Atom)